
How a mid-size engineering enterprise replaced fragmented reporting with real-time business intelligence
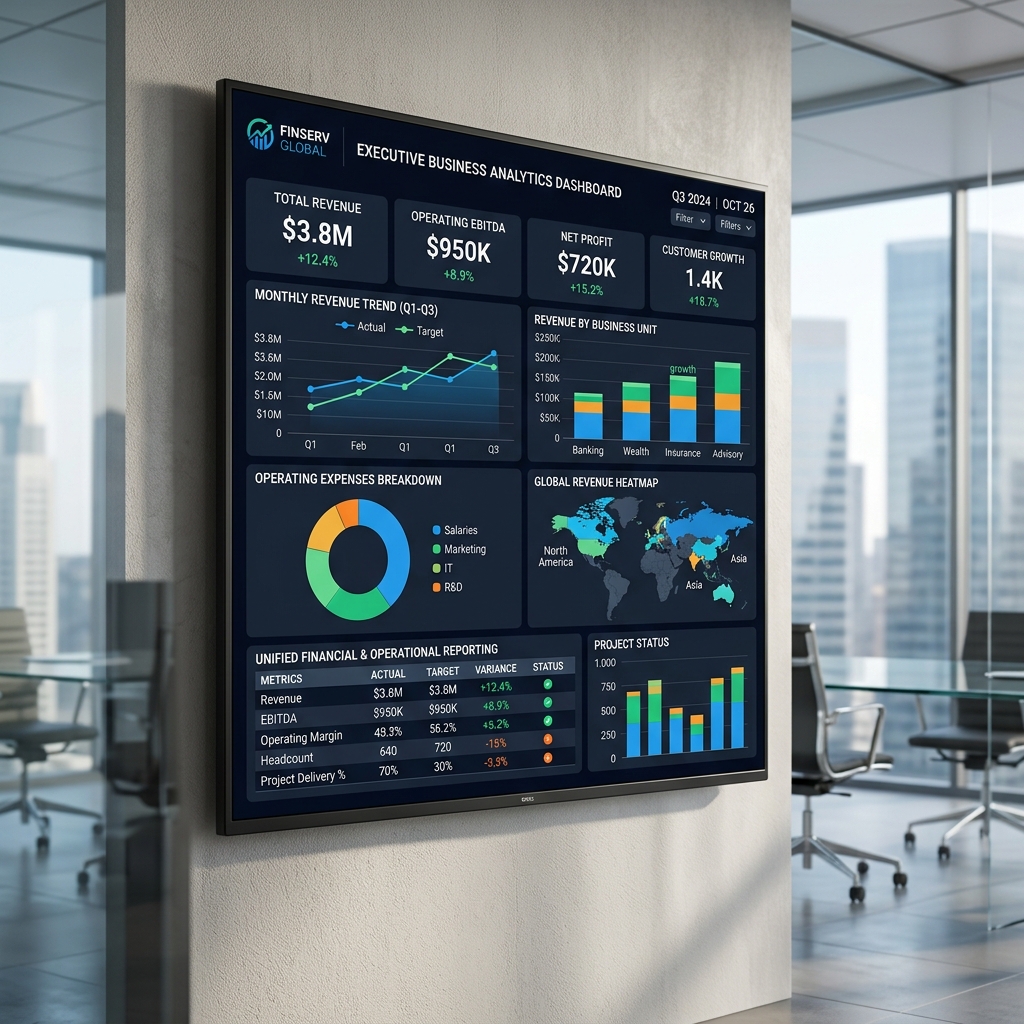
For years, one of India's leading engineering and manufacturing organizations relied on multiple disconnected business systems to manage finance, operations, human resources, and project estimation. While each application served its purpose, executives struggled to obtain a unified view of business performance.
Critical information was scattered across ERP, HRMS, estimation software, spreadsheets, and departmental reports. Leadership meetings were often consumed by discussions over conflicting numbers instead of strategic decisions. Preparing monthly business reviews required significant manual effort, and managers lacked the ability to investigate issues quickly.
To address these challenges, the organization partnered with VM Micro Analytics to implement an Enterprise Intelligence Dashboard—a unified decision-support platform that consolidates enterprise data into a single, role-based interface with interactive KPI monitoring, drill-down analytics, AI-assisted business insights, and secure reporting.
Today, business leaders access trusted information in seconds, enabling faster, data-driven decisions across the enterprise.
The organization operated multiple business units, but fragmented systems made it difficult to obtain a single version of the truth for enterprise performance.
Each department generated reports independently, resulting in inconsistent metrics and multiple versions of the truth.
Finance and operations teams spent several days every month consolidating information before executive review meetings.
Managers could monitor high-level KPIs but had no efficient mechanism to investigate the underlying causes of performance variations.
Business decisions were often delayed because executives had to request additional reports from multiple departments before reaching conclusions.
Business users depended on analysts to answer even routine questions regarding business performance.
VM Micro Analytics designed and deployed a modern Enterprise Dashboard platform that transformed enterprise reporting into an interactive decision-support system. The platform integrates data from multiple enterprise applications while maintaining each source system as the system of record. Information is presented through role-based dashboards tailored to executives, finance managers, HR leaders, operations managers, and department heads.
Business data from ERP, HRMS, and estimation systems is consolidated into a single interface, eliminating fragmented reporting.
Each user views only the KPIs relevant to their responsibilities, ensuring both usability and security.
Users can monitor financial, operational, and HR performance through intuitive KPI cards and visual dashboards.
Managers can move seamlessly from executive summaries to detailed transactional information, enabling rapid root-cause analysis.
Users interact with business data using natural language questions regarding profitability or regional growth comparisons.
The solution incorporates role-based access, audit logging, secure data access, and controlled exports to ensure compliance with enterprise security standards.
Our structured six-phase implementation methodology ensures seamless transition and rapid user alignment.
Business KPI discovery and stakeholder workshops
Integration with ERP, HRMS, and estimation systems
Dashboard development and KPI validation
Role-based dashboard configuration
AI-assisted analytics enablement
User training and enterprise rollout
Leadership gained immediate access to trusted business information through a unified dashboard, significantly reducing dependence on manual reports.
Automated KPI generation eliminated repetitive reporting activities, allowing business teams to focus on analysis rather than data preparation.
Interactive drill-down capabilities enabled managers to identify performance issues quickly and take corrective action with greater confidence.
Standardized KPI definitions improved alignment across departments and strengthened confidence in business reporting.
The intuitive interface and AI-assisted analytics enabled business managers—not just analysts—to explore data independently.
Planned future roadmap initiatives to scale capabilities and integration.
Enabling advanced natural-language interface and chat capabilities for business queries.
Applying forecasting algorithms to anticipate business performance trends.
Developing AI recommendations to assist decision-makers in optimizing business processes.
Triggering automated workflows based on predefined KPI alerts and notifications.
"VM Micro Analytics has fundamentally changed the way we manage our business. What previously took days of manual effort is now available instantly through a single dashboard. The ability to drill into KPIs and interact with our data using natural language has empowered our leadership team to make faster, better-informed decisions. The platform has become an essential part of our daily operations."— Chief Executive Officer Mid-Size Engineering & Manufacturing Enterprise
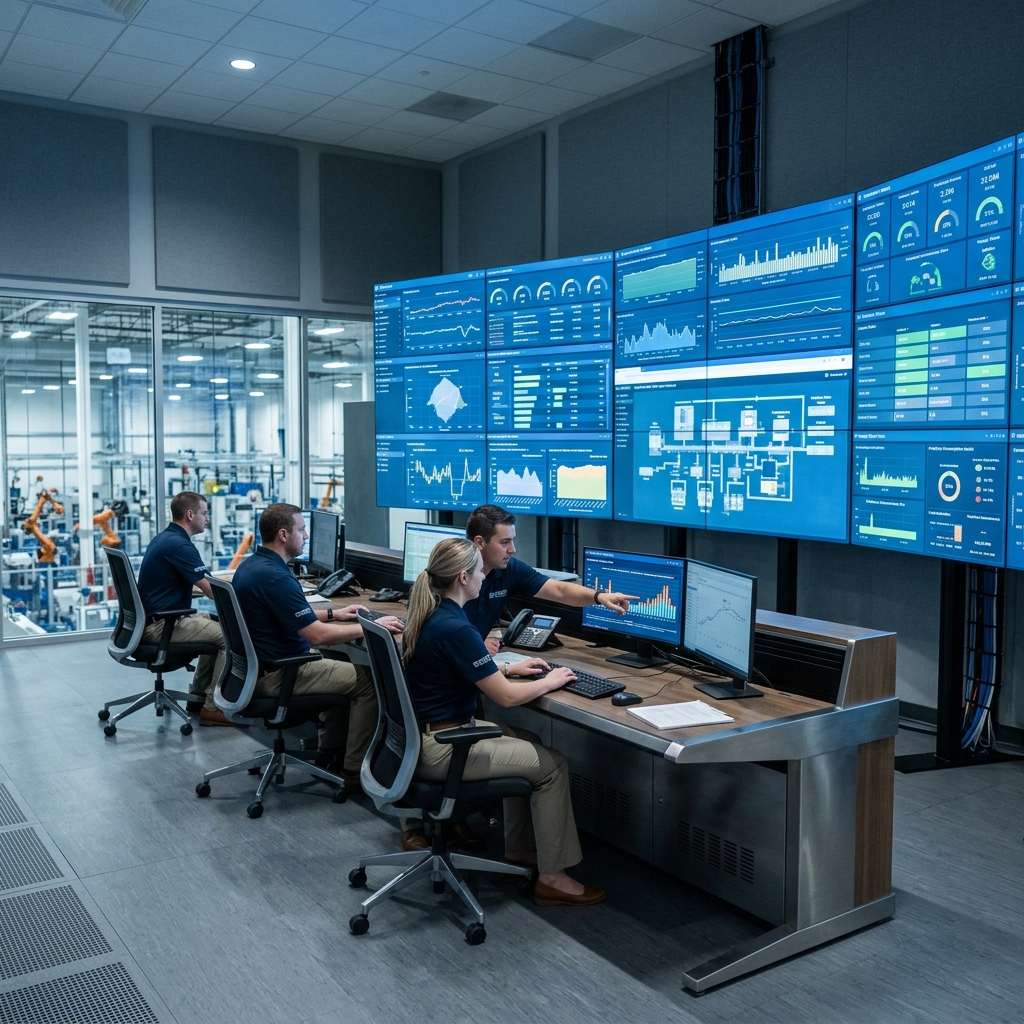
An industrial engineering manufacturer deployed an AI-driven operational intelligence platform, integrating production, maintenance, and quality data for real-time performance monitoring and proactive bottleneck identification.
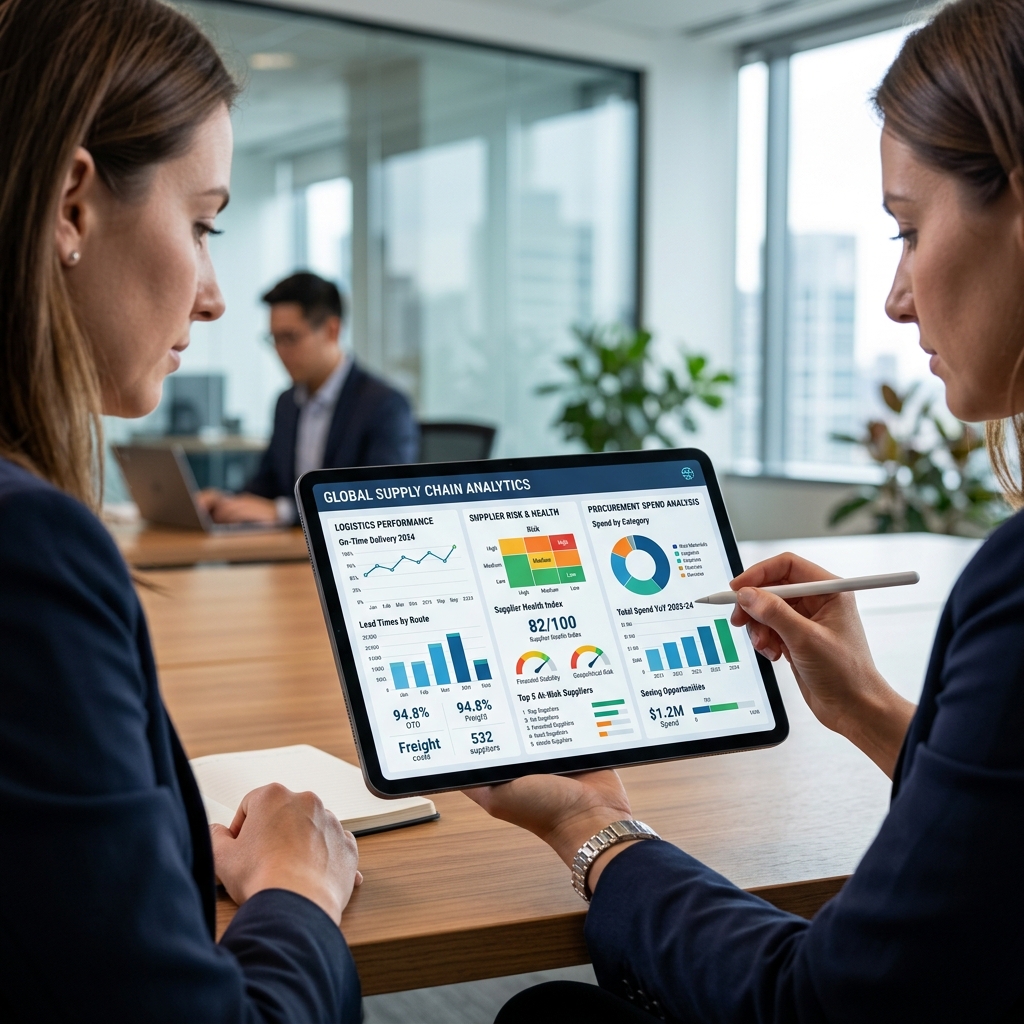
An equipment manufacturer implemented an AI-powered procurement intelligence platform, providing real-time supplier performance scorecards, spend analytics, and early risk detection to improve supply chain resilience.

A multi-location engineering company implemented the e-Travel platform, a six-role web application with DTP forms and conversational chatbot autofill, digitizing approvals and travel desk operations.
Explore how VM Micro can help address complex operational, engineering, analytics, or transformation challenges with practical AI solutions.